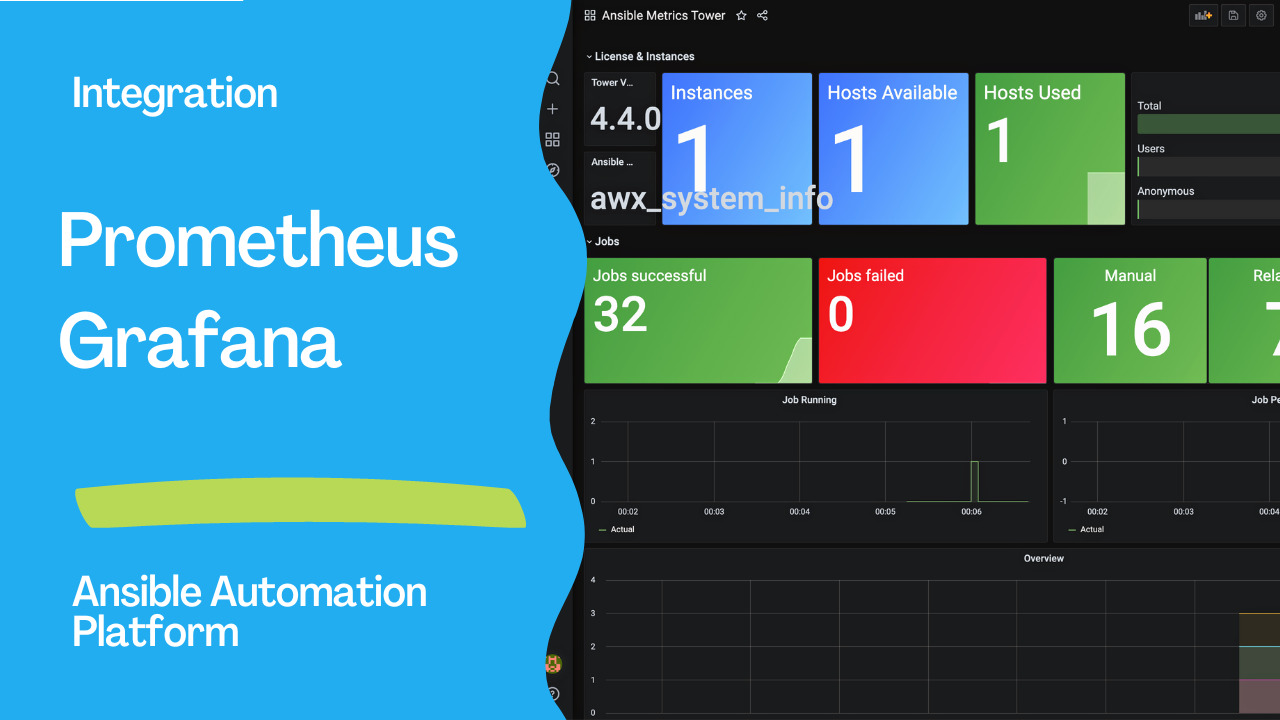
Integrate Automation Controller, Prometheus, and Grafana to IT Monitor Realtime
By Luca Berton · Published 2024-01-01 · Category: security-compliance
How to integrate Automation Controller, Prometheus, and Grafana to create a real-time Service Monitor Dashboard.
Introduction
In the dynamic realm of IT management, staying ahead requires more than just basic monitoring; it demands a symphony of real-time insights, seamless data collection, and actionable visualization. Enter the trifecta of Automation Controller, Prometheus, and Grafana . This powerful integration forms the backbone of modern IT monitoring, providing an unparalleled ability to orchestrate, gather, and harmoniously visualize data.The Symphony of Integration: Automation Controller, Prometheus, and Grafana
Imagine a scenario with a fleet of servers, applications, and resources humming away in your IT environment. While each component holds its significance, the true magic unfolds when they synchronize and collaborate seamlessly. This is precisely what the integration of Automation Controller, Prometheus, and Grafana aims to achieve — a harmonious symphony of IT orchestration, data collection, and visualization.- Automation Controller: The Conductor of IT Operations
- Prometheus: The Virtuoso Data Collector
- Grafana: The Visualization Virtuoso
See also: Integrate Splunk with Ansible Automation Controller: Logging & Monitoring Guide
Integration Unleashed: How It Works
The integration dance begins with Prometheus, which diligently gathers data from every corner of your IT environment. This treasure trove of data is then funneled into Grafana’s sophisticated dashboarding platform, where it’s sculpted into meaningful visualizations. These visualizations, in turn, are orchestrated and aligned with Automation Controller’s operations, creating a seamless flow of insights that empowers you to make informed decisions, pre-empt issues, and optimize performance.Empowering IT Excellence: The Benefits
The integration of Automation Controller, Prometheus, and Grafana bestows a plethora of benefits on your IT landscape:Real-Time Awareness: Stay in the loop with instant insights into your infrastructure’s health and performance, enabling proactive response and rapid issue resolution. Actionable Intelligence: Translate complex data into actionable intelligence with intuitive visualizations that empower you to make strategic decisions confidently. Efficiency Amplification: Let Automation Controller manage routine tasks, freeing your team to focus on strategic initiatives that drive innovation and growth. Holistic Monitoring: Monitor every facet of your environment, from applications and services to hardware and networks, ensuring no corner remains hidden. Scalability and Flexibility: Seamlessly scale your monitoring efforts as your IT landscape evolves, adapting to new challenges and opportunities.
- /etc/prometheus/prometheus.yml
global:
  evaluation_interval: 15s
  scrape_interval: 15s
  scrape_timeout: 10s

  external_labels:
    environment: grafana.example.com

rule_files:
  - /etc/prometheus/rules/*.rules

scrape_configs:
  - job_name: prometheus
    metrics_path: /metrics
    static_configs:
    - targets:
      - grafana.example.com:9090
  - file_sd_configs:
    - files:
      - /etc/prometheus/file_sd/node.yml
    job_name: node

  - job_name: 'tower'
    tls_config:
        insecure_skip_verify: True
    metrics_path: /api/v2/metrics
    scrape_interval: 5s
    scheme: https
    bearer_token: HLQ5mK0Ehei7zETdupEiq6iGCME99Y
    # basic_auth:
    #   username: admin
    #   password:
    static_configs:
        - targets:
           - ac.example.com
After successful integration with Prometheus, the data are starting to flow into the Grafana Dashboard. We can create our design Dashboard like the following:
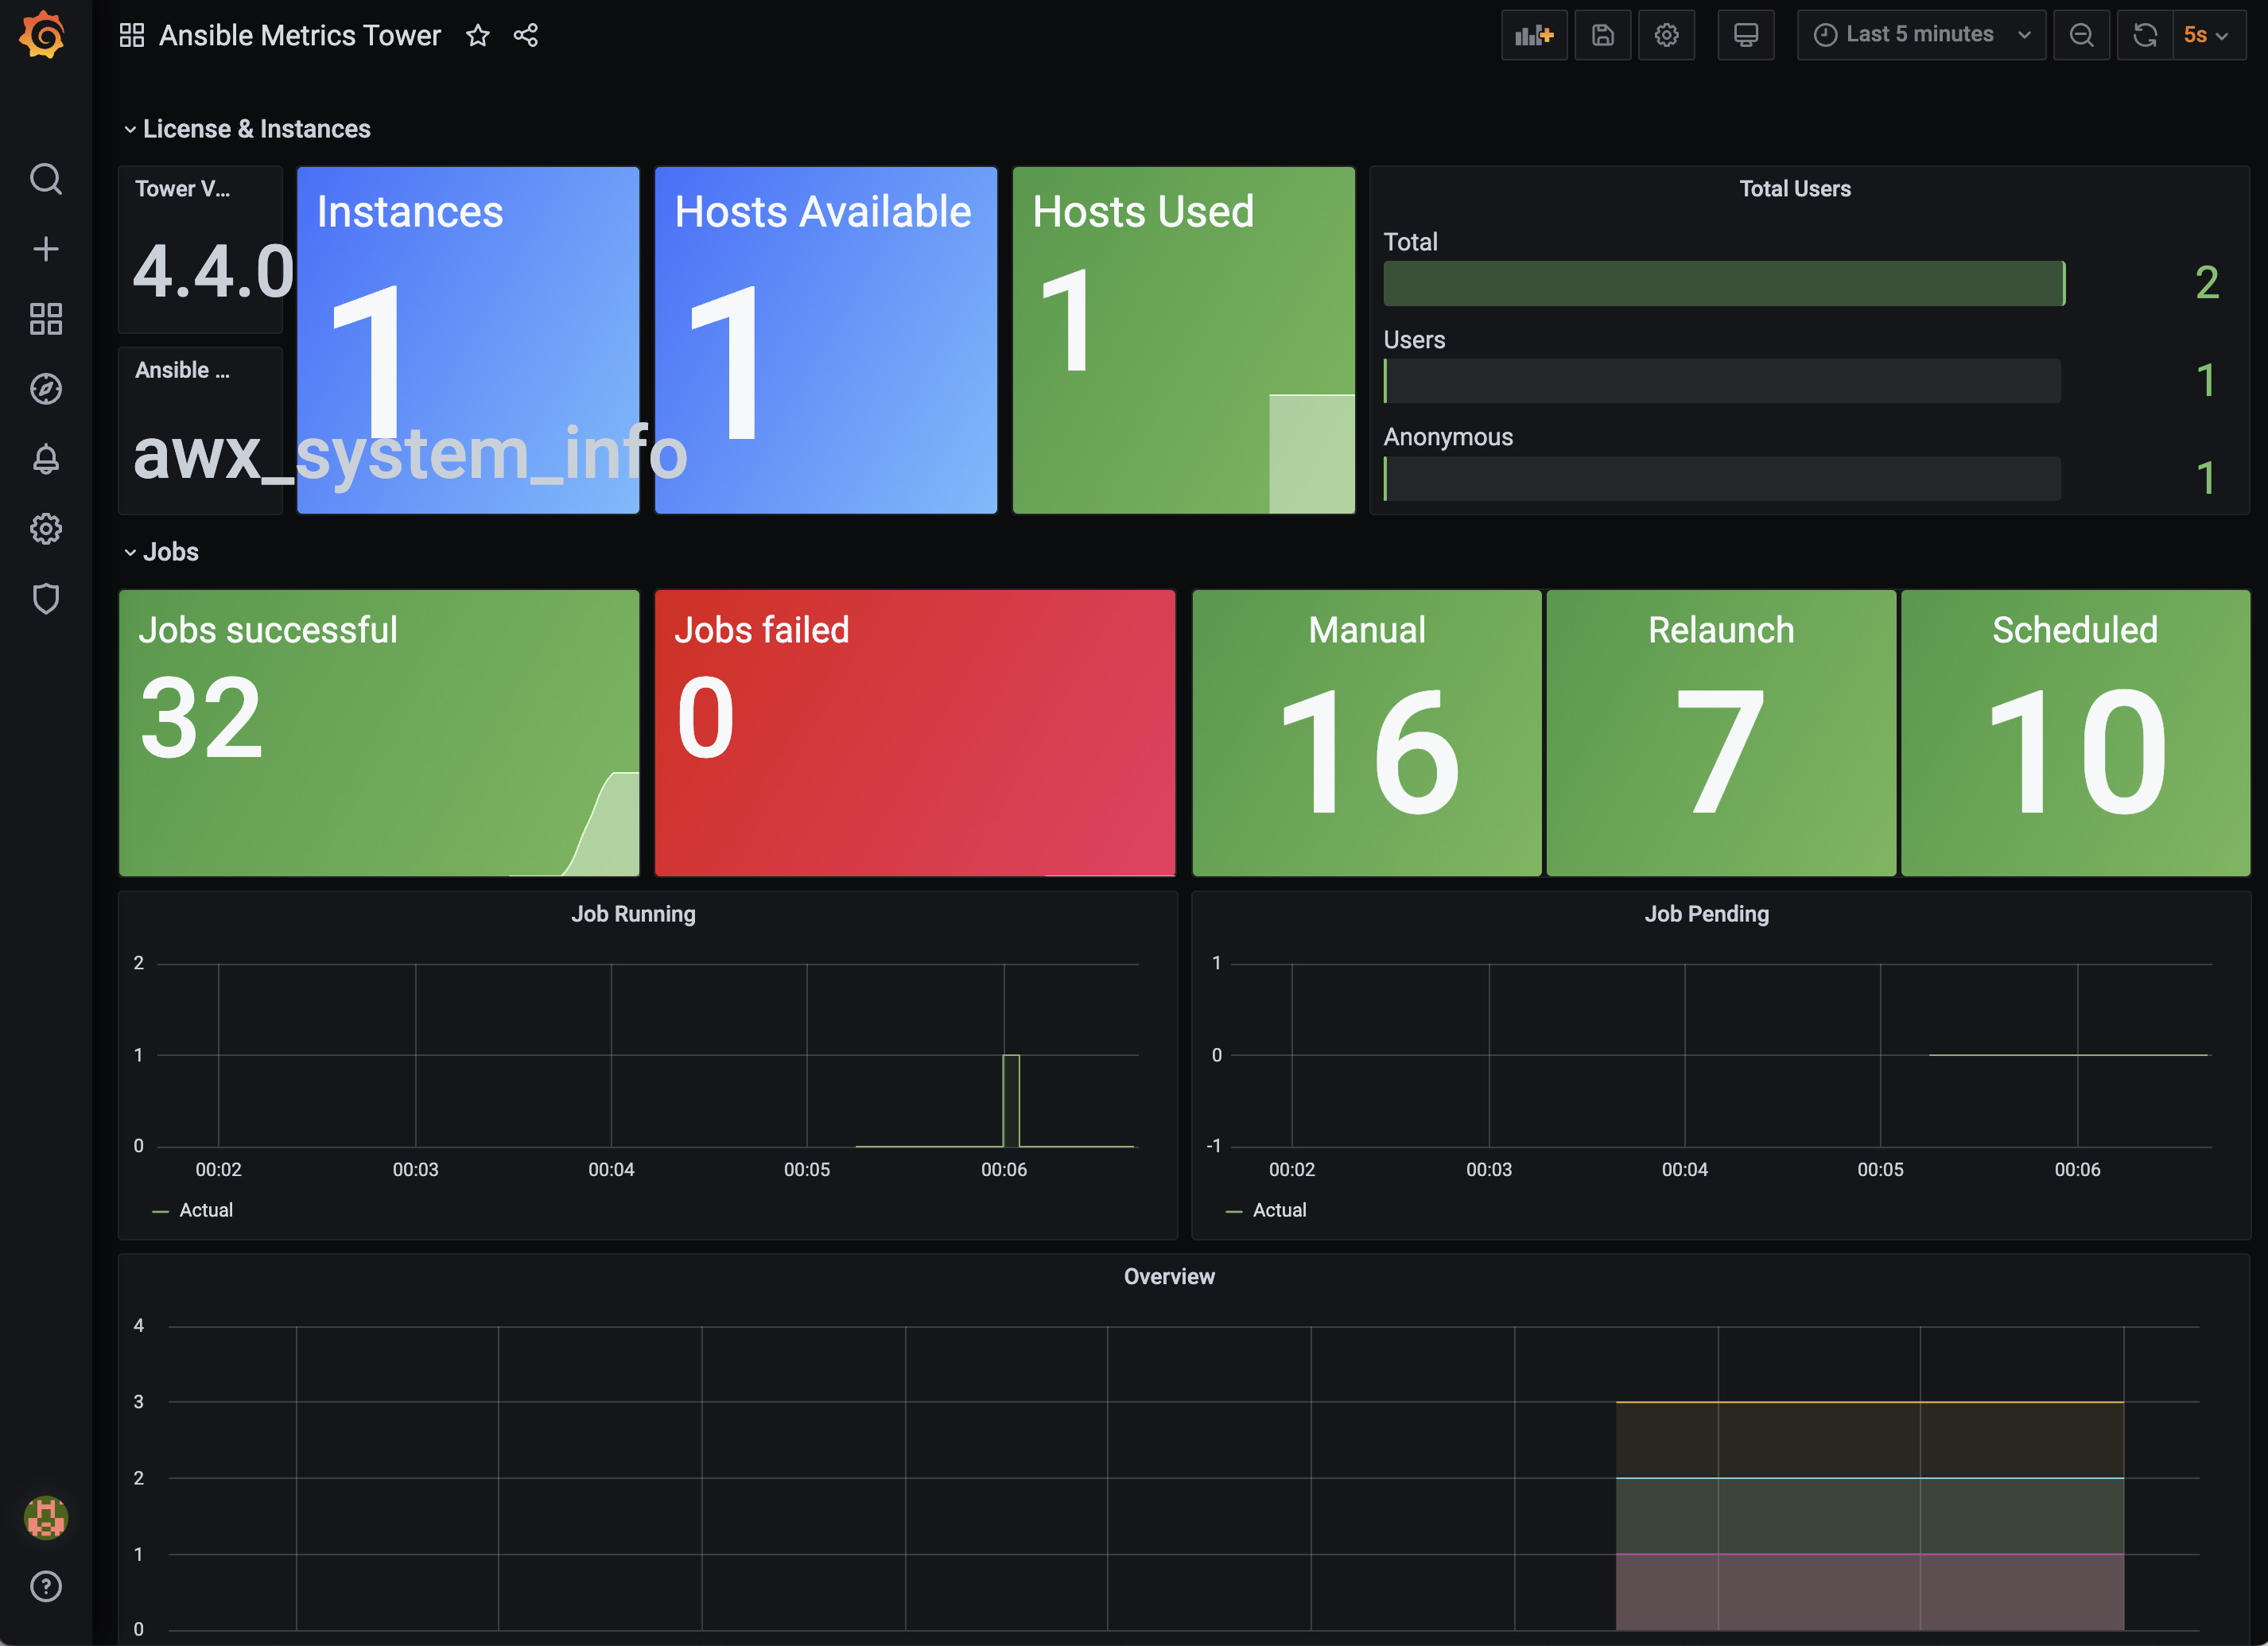
Disclaimer: The images and configuration examples provided are for illustrative purposes only and may vary based on the specific versions of Automation Controller, Prometheus and Grafana.
Conclusion
In a world where data is the currency of progress, the integration of Automation Controller, Prometheus, and Grafana emerges as a transformative force. It ushers in a new era of IT monitoring, where orchestration, data collection, and visualization converge to create a symphony of operational excellence. With this integration, you’re not just monitoring — you’re conducting a data-driven symphony that resonates with efficiency, insights, and growth.See also: AAP 2.6 Monitoring and Logging: Prometheus, Grafana, and Log Aggregation
Related Articles
- sudo and become in Ansible playbooks
- iterating tasks with Ansible loops
- Integrate Splunk with Ansible Automation Controller: Logging & Monitoring Guide
See also
Category: security-compliance
Watch the video: Integrate Automation Controller, Prometheus, and Grafana to IT Monitor Realtime — Video Tutorial