Introduction
In today’s rapidly evolving IT landscape, robust logging and centralized log aggregation are critical components for ensuring your infrastructure’s stability, security, and performance. Automation Controller, a powerful tool in the realm of IT operations, offers seamless integration with external log aggregation services like Splunk, enabling you to gain valuable insights into your system’s behavior and troubleshoot issues effectively. We explore how to set up Splunk logging integration with Automation Controller using the Splunk HTTP Collector.
Logging plays a pivotal role in providing comprehensive insights into the performance and usage of systems. Ansible Automation Controller offers a powerful logging and aggregation feature, enabling detailed logs to be sent to third-party external log aggregation services. These services serve as valuable tools for understanding controller behavior, technical trends, and system health.
Key Highlights:
- Aggregated Data: By sending logs to external aggregation services, administrators gain the ability to analyze events within the infrastructure comprehensively. This helps in monitoring for anomalies, correlating events between different services, and gaining deeper insights into system operations.
- Data Types: The types of data most beneficial to the controller include job fact data, job events/job runs, activity stream data, and log messages. These data types provide a well-rounded view of the controller’s activities and performance.
- Data Format and Transmission: Logs are sent in JSON format over an HTTP connection. This ensures efficient data transmission while allowing for minimal service-specific adjustments.
- rsyslog Version and Management: Ansible Automation Controller installation updates the rsyslog version. To avoid conflicts and ensure proper logging, administrators are advised to use the controller-provided rsyslog package. For systems that use rsyslog outside the controller, careful consideration is needed to prevent version conflicts.
- Configurable Handling of Offline Logging: The controller’s rsyslog process can be configured to manage messages during external logger outages. Parameters like LOG_AGGREGATOR_MAX_DISK_USAGE_GB and LOG_AGGREGATOR_MAX_DISK_USAGE_PATH determine how logs are stored and retried.
Loggers: Different Perspectives on Data:
- job_events: Provides data from the Ansible callback module, giving insights into job executions.
- activity_stream: Tracks changes to objects within the automation controller application, aiding in understanding user actions and system modifications.
- system_tracking: Gathers fact data through the Ansible setup module, particularly valuable when job templates are executed with “Enable Fact Cache” selected.
- awx: Offers generic server logs, capturing standard metadata and log message content.
- Standard Controller Logs: These logs can be managed similarly to specialized loggers and can be enabled or disabled as needed.
Logging Schema and Configuration:
- Common Schema: Loggers share a common schema, including cluster_host_id, level, logger_name, @timestamp, and path.
- Activity Stream Schema: Besides the common schema, the activity stream schema features fields like actor, changes, operation, object1, and object2.
- Job Event Schema: Reflects data saved into job events, with special fields for event data and host information.
- Scan/Fact/System Tracking Schema: These schemas contain detailed dictionary-type fields related to services, packages, files, hosts, and inventories.
- Job Status Changes: Captures changes in job states, serving as a lower-volume source of information compared to job events.
- Controller Logs: These logs include a msg field with log messages and can be enabled/disabled from the Logging settings.
Logging Aggregator Services
The logging aggregator service facilitates integration with various monitoring and analysis systems:
Splunk: Utilizes the Splunk HTTP Collector for integration. Configuration settings, such as the host and loggers to send data, ensure seamless data transfer. Loggly: Set up logs transmission through Loggly’s HTTP endpoint. Sumologic: Create search criteria for collecting data needed for analysis. Elastic Stack: Requires configurations in the logstash logstash.conf file for integration.
Links
- https://www.ansible.com/integrations/devops-tools/splunk
- https://docs.ansible.com/automation-controller/latest/html/administration/logging.html
- https://docs.splunk.com/Documentation/Splunk/9.1.0/Data/UsetheHTTPEventCollector

Why Splunk Logging Integration Matters
Effective log management is a cornerstone of modern IT operations. It allows organizations to proactively monitor their systems, detect anomalies, troubleshoot issues, and ensure compliance with industry standards. Splunk, a popular log aggregation and analysis platform, provides powerful capabilities to collect, index, search, and analyze machine-generated data. By integrating Splunk with Automation Controller, you can harness the full potential of your log data and derive actionable insights from it.
Step 1: Enable HTTP Event Collector (HEC) data input in Splunk You must satisfy all of the following conditions when you send data to HEC:
HEC must be enabled
You must have at least one active HEC token available.
You must use an active token to authenticate into HEC
You must format the data in “_json” that goes to HEC in a certain way.
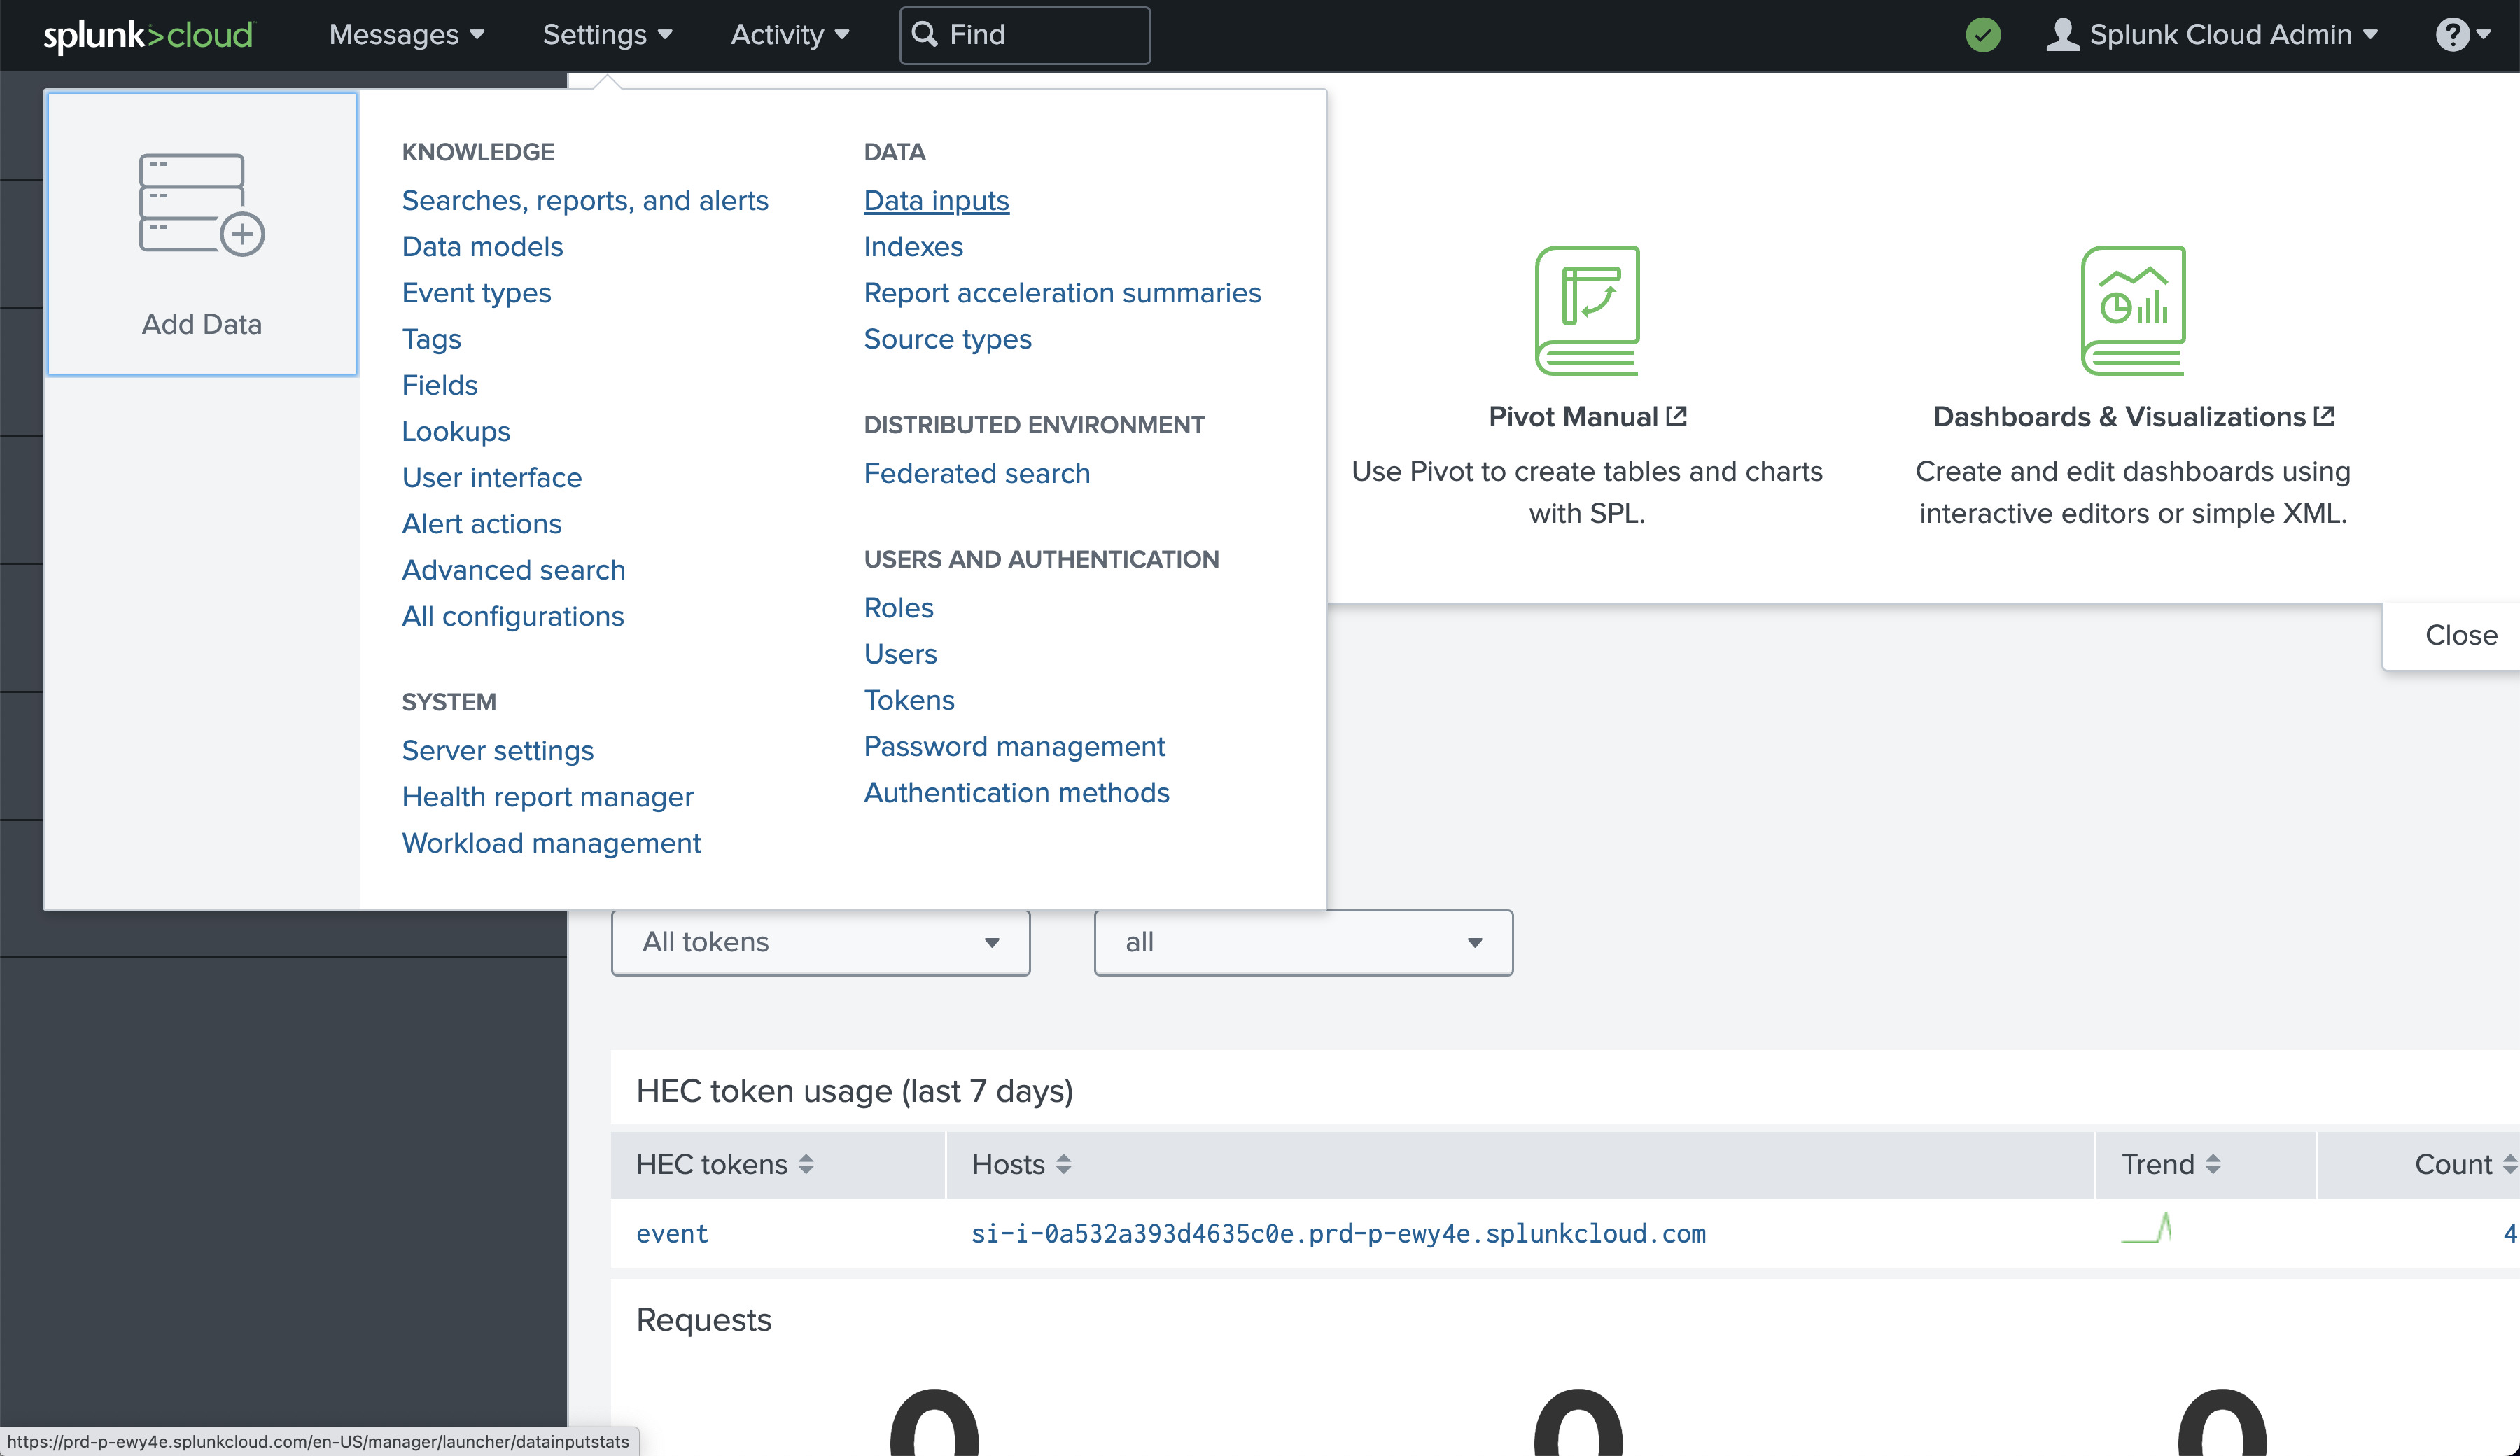
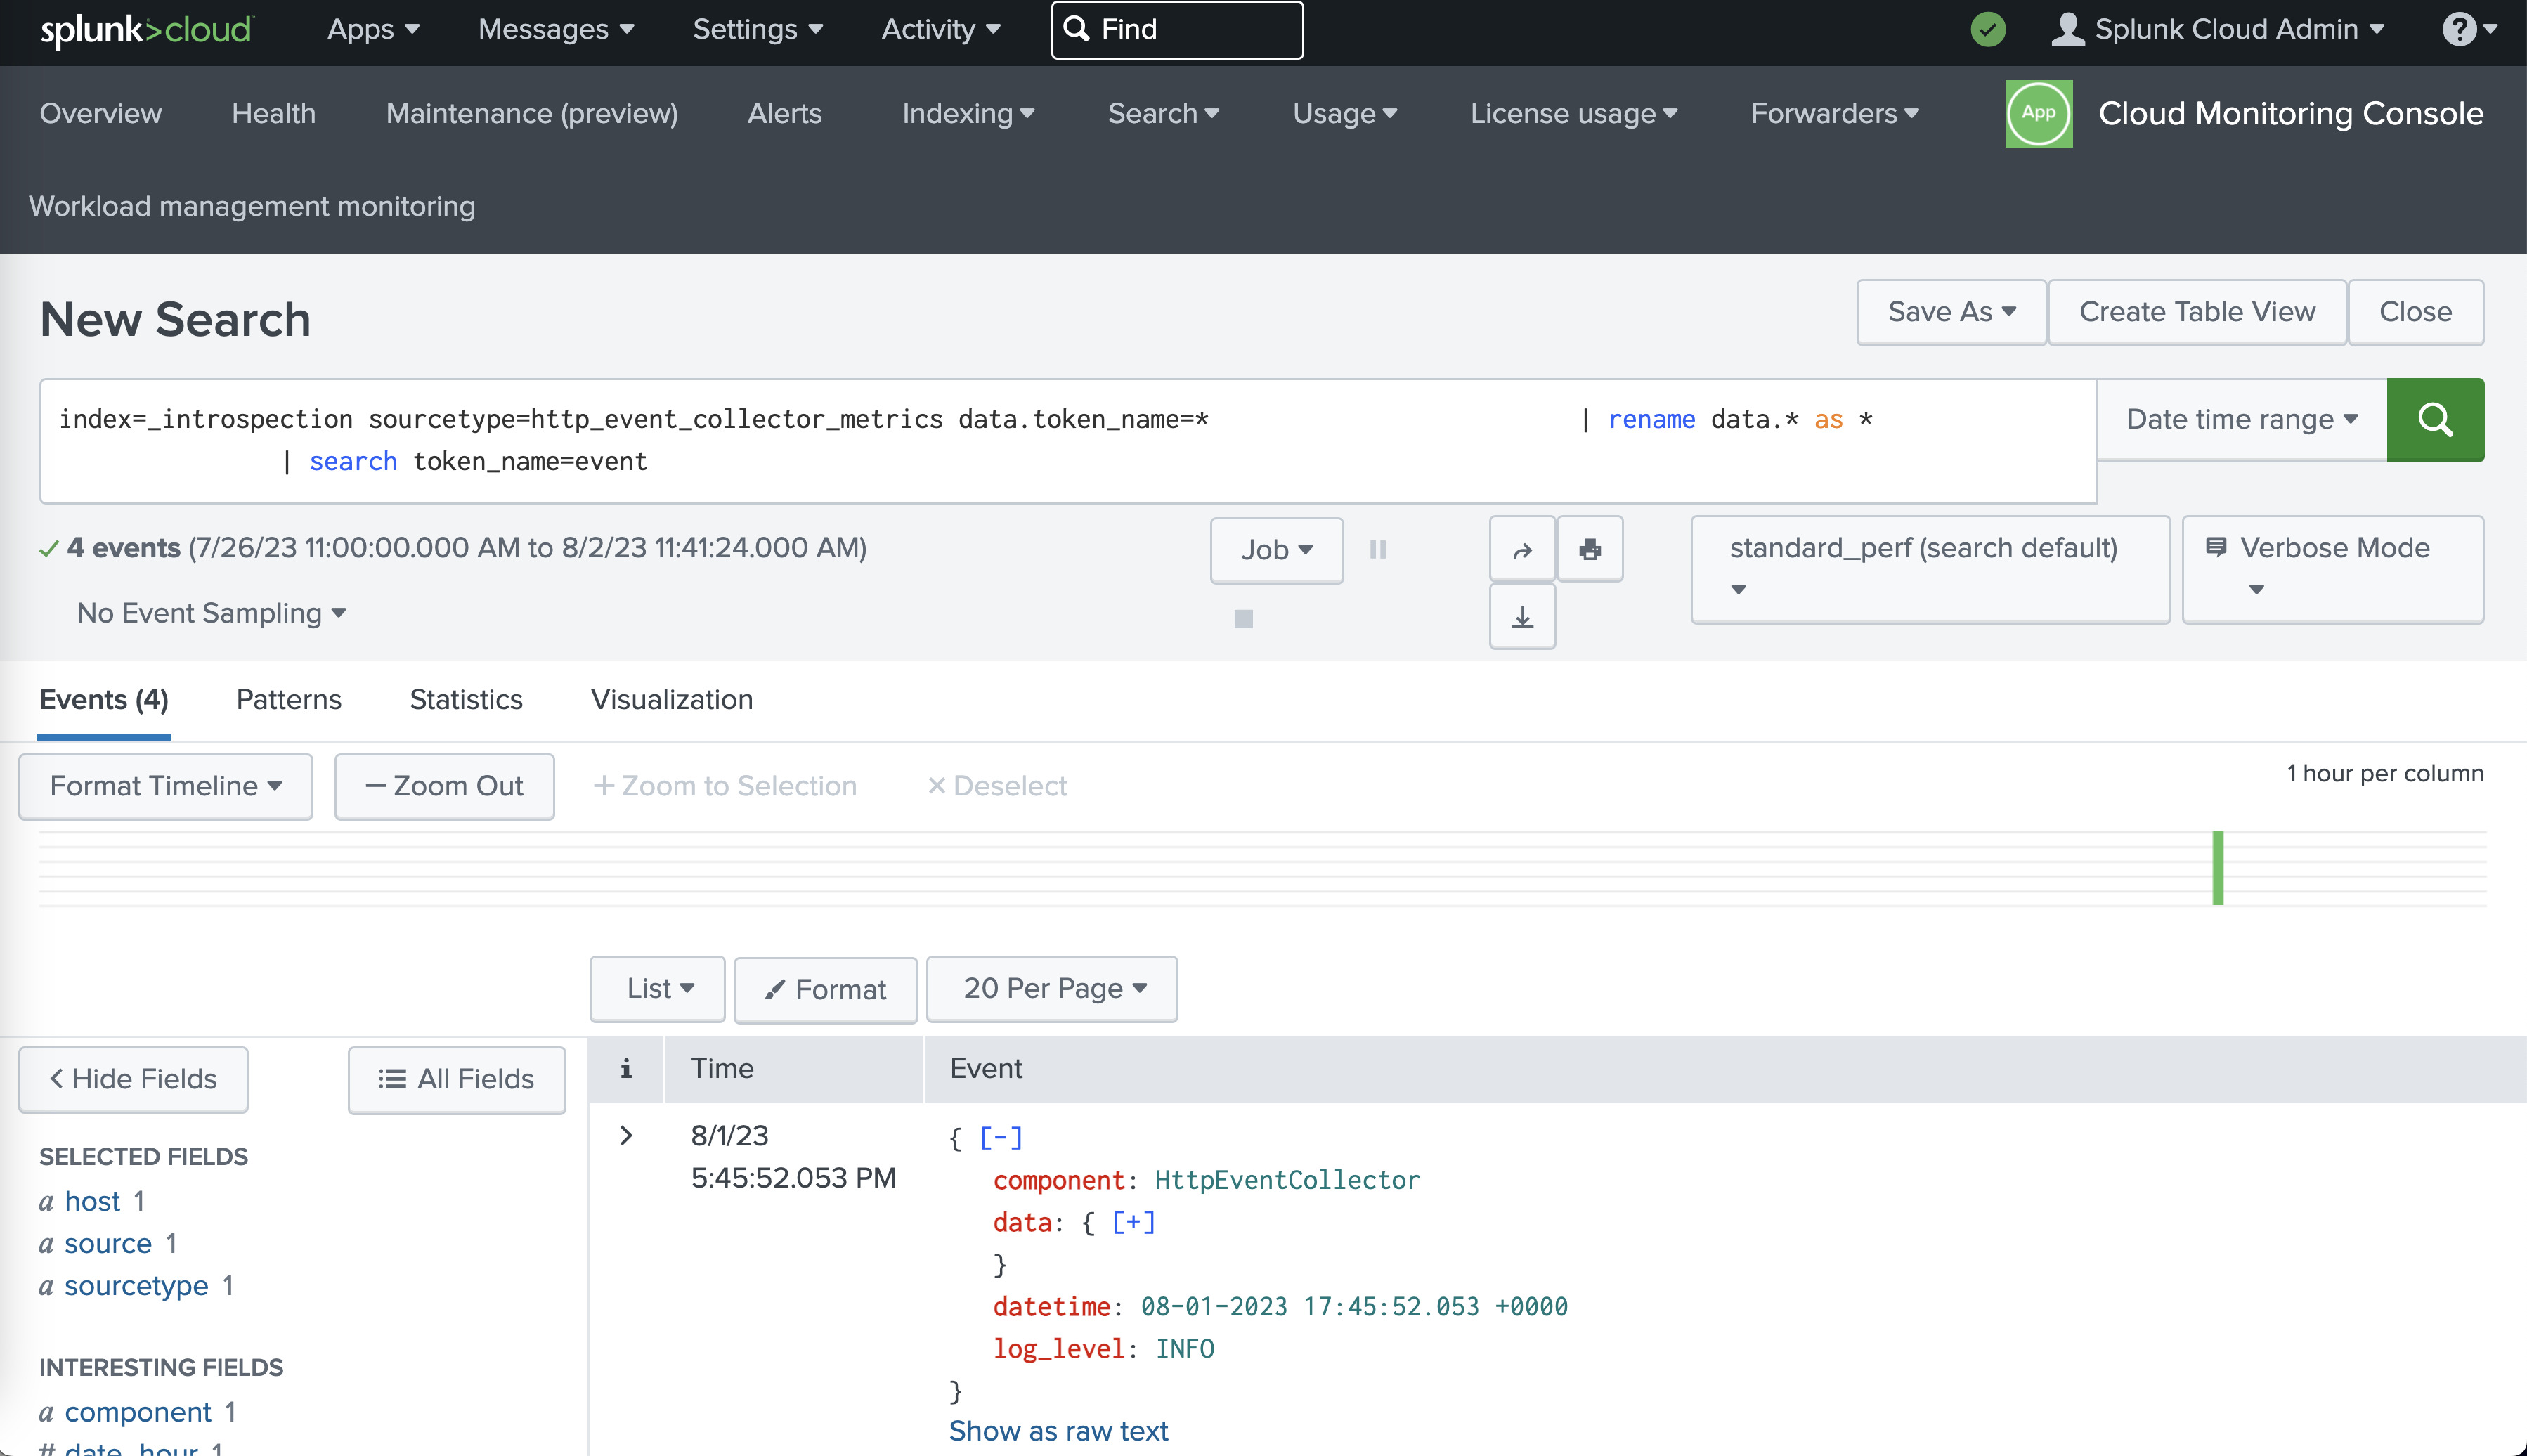
We can test the Splunk endpoint using the curl command line utility:
curl -k https://splunk.example.com:8088/services/collector/event -H "Authorization: Splunk 12345678-1234-1234-1234-123456789012" -d '{"event": "hello world"}'
- Step 2: Configuring the Splunk Logging Aggregator To begin the process of integrating Splunk with the Automation Controller, you need to configure the Splunk Logging Aggregator. Here’s a step-by-step guide to setting up the integration:
Access the Logging Settings: Log in to your Automation Controller instance and navigate to the “Logging settings” section. This can usually be found within the “Settings” menu.
2. Add Splunk Logging Configuration: Create a new configuration for the Splunk Logging Aggregator. You will need to specify various parameters to establish the connection between Automation Controller and Splunk via the User Interface Settings > Logging or via the API (/api/v2/settings/logging/).
LOG_AGGREGATOR_HOST: Provide the full URL to the Splunk HTTP Event Collector host. It should follow the format: https://splunk.example.com:8088/services/collector/event.
LOG_AGGREGATOR_TYPE: Set the aggregator type to “splunk”.
LOG_AGGREGATOR_USERNAME and LOG_AGGREGATOR_PASSWORD: If required, enter the username and password for authentication. Alternatively, you can use an OAuth2 token.
LOG_AGGREGATOR_LOGGERS: Define the loggers you want to send data from. Common options include “awx”, “activity_stream”, “job_events”, and “system_tracking”.
LOG_AGGREGATOR_ENABLED: Set this to true to enable the Splunk Logging Aggregator.
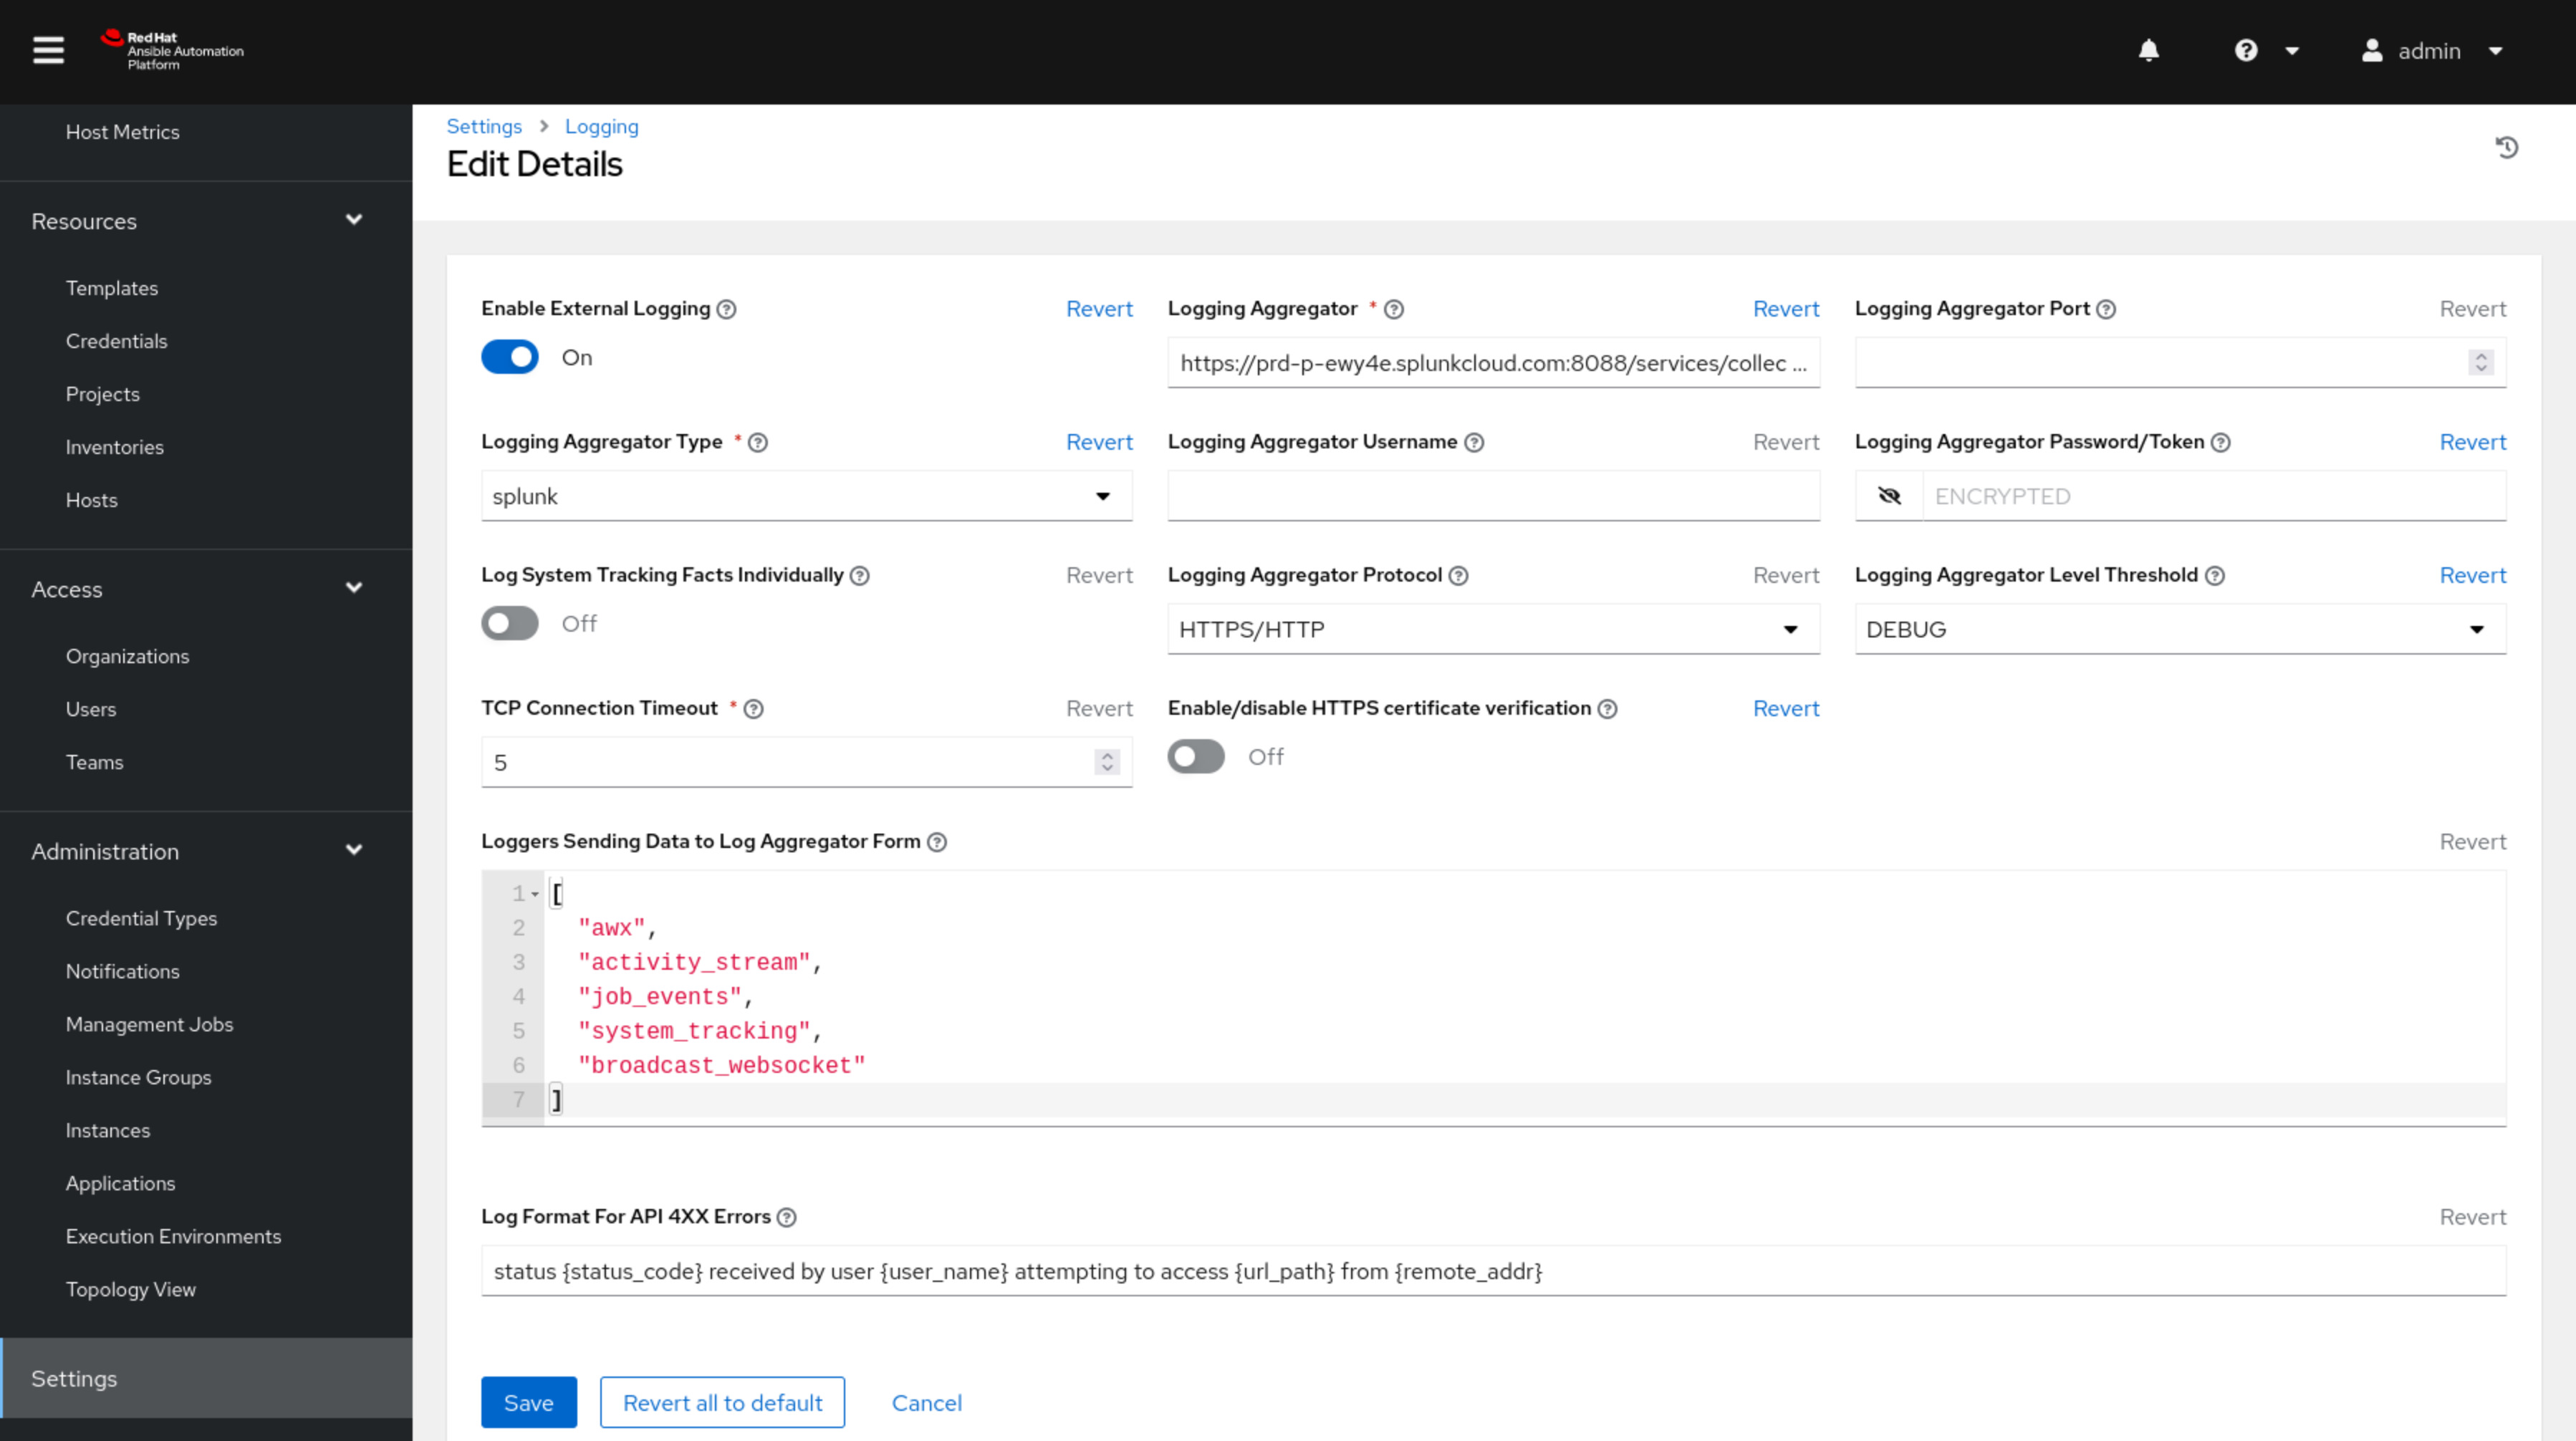
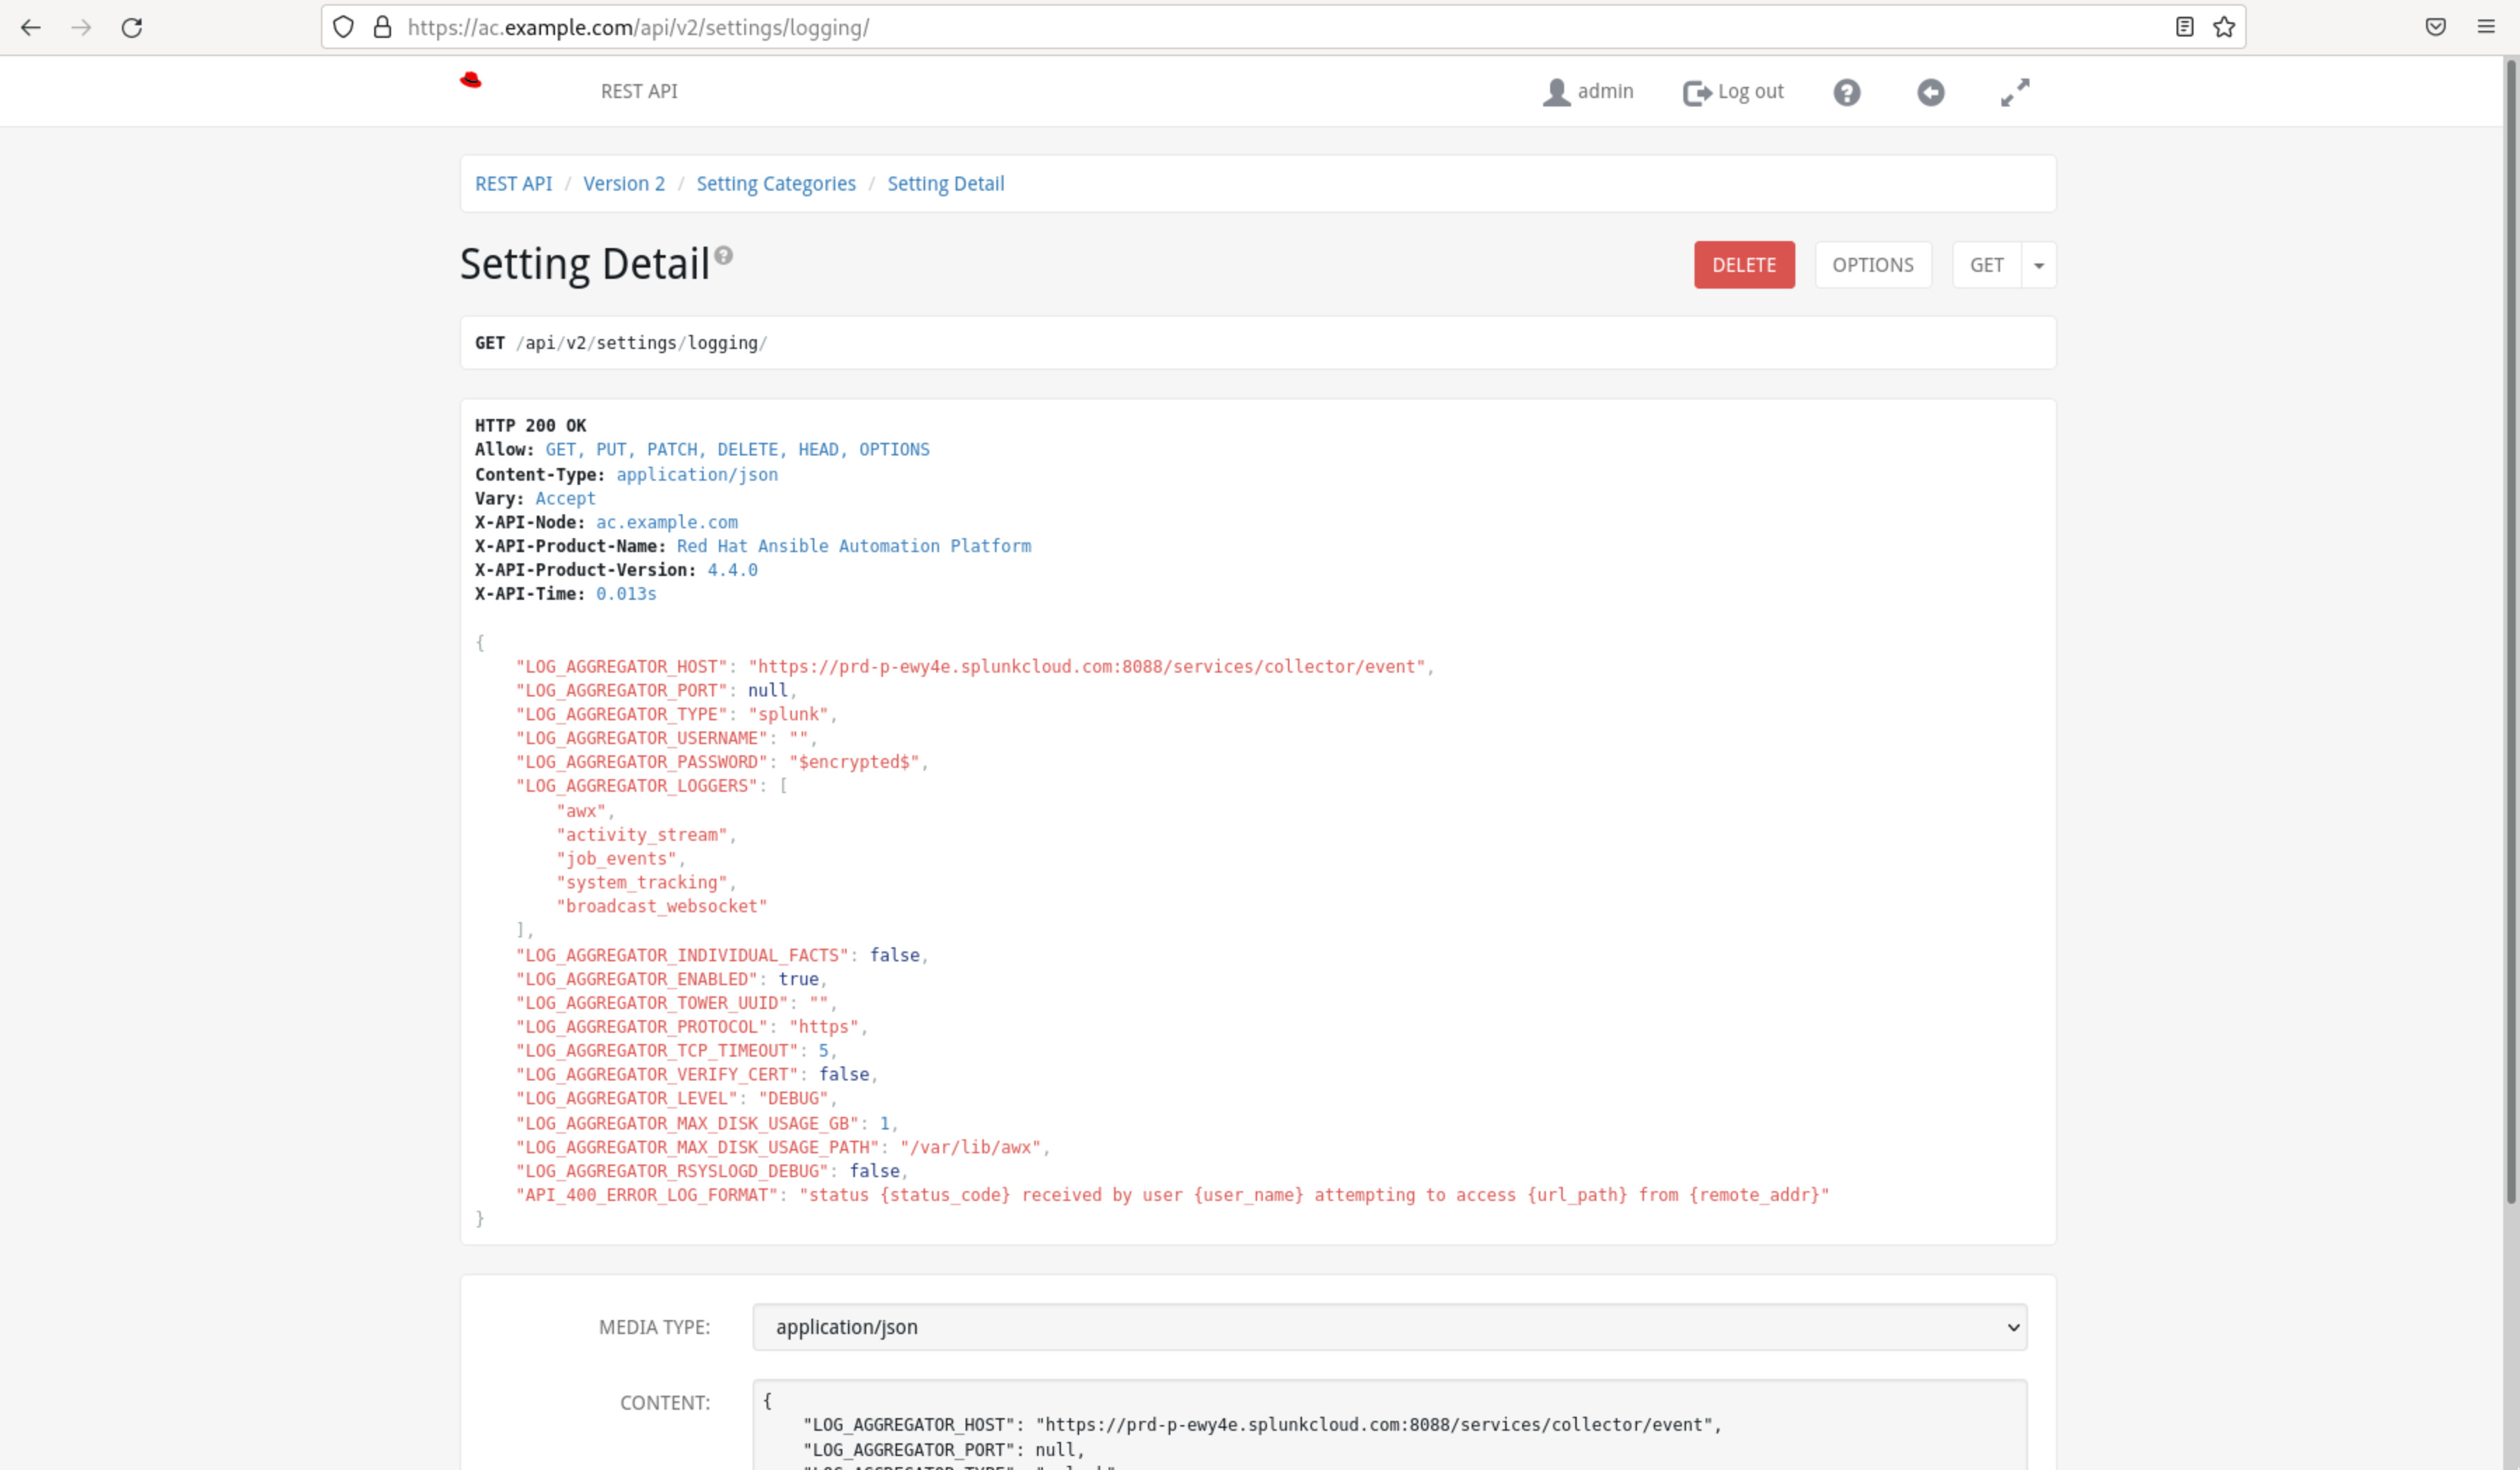
- Configure Additional Settings: Depending on your requirements, you can adjust other settings, such as
LOG_AGGREGATOR_MAX_DISK_USAGE_GBandLOG_AGGREGATOR_MAX_DISK_USAGE_PATH, to control how the controller handles messages during an external logger outage.

Conclusion
Integrating Splunk logging with Automation Controller empowers IT operations teams with comprehensive insights into system behavior, performance, and events. By sending detailed logs to Splunk, you can efficiently monitor, analyze, and troubleshoot issues, ensuring the reliability and security of your infrastructure. Additionally, setting up Prometheus for metrics collection further enhances your ability to gain a holistic view of your Automation Controller environment.
As you embark on this integration journey, remember to consult both the Automation Controller and Splunk documentation for detailed configuration options and best practices. By effectively harnessing the power of log aggregation and analysis, you position your organization for proactive and data-driven IT operations management.
For further assistance and detailed instructions, refer to the official documentation of Automation Controller and Splunk.
Disclaimer: The images and configuration examples provided are for illustrative purposes only and may vary based on the specific versions of Automation Controller and Splunk.
Conclusion
Logging and aggregation empower administrators to monitor, analyze, and troubleshoot Ansible Automation Controller effectively. By integrating with external aggregation services and leveraging various loggers, the controller’s behavior and performance become transparent. The seamless integration with monitoring systems like Splunk, Loggly, Sumologic, and Elastic Stack further enhances administrators’ ability to gain actionable insights and ensure the robustness of their infrastructure. This logging and aggregation capability is a key tool for maintaining efficient and reliable operations in Ansible-powered environments.
Subscribe to the YouTube channel, Medium, and Website, X (formerly Twitter) to not miss the next episode of the Ansible Pilot.Academy
Learn the Ansible automation technology with some real-life examples in my
Udemy 300+ Lessons Video Course.

My book Ansible By Examples: 200+ Automation Examples For Linux and Windows System Administrator and DevOps

Donate
Want to keep this project going? Please donate
