Introduction
When managing infrastructure with Ansible, it’s essential to have insights into resource consumption and performance metrics during playbook execution. Ansible provides a powerful tool for this purpose: callback plugins. This article explores how callback plugins can help you assess resource consumption, troubleshoot issues, and gain deeper insights into Ansible playbook execution.
Understanding Ansible Callback Plugins
What are Ansible callback plugins? According to Ansible’s documentation, callback plugins enable adding new behaviors to Ansible when responding to events. These plugins control most of the output you see when running Ansible commands, but they can also be used to:
- Add additional output.
- Integrate with other tools.
- Marshal events to a storage backend. Callback plugins are a versatile way to customize and enhance Ansible’s functionality.
Focus on cgroup_memory_Conclusion and cgroup_perf_recap
This article focuses on two specific callback plugins: cgroup_memory_Conclusion and cgroup_perf_recap. These plugins utilize cgroups (Control Groups) to profile resource consumption during Ansible tasks and playbook execution.
cgroup_memory_Conclusion: This plugin profiles the maximum memory usage of Ansible and individual tasks and provides a recap at the end using cgroups.cgroup_perf_Conclusion: This plugin profiles system activity, including memory and CPU usage, of Ansible and individual tasks and displays a recap at the end of playbook execution. You can learn more about these plugins and their parameters by using theansible-doccommand:
ansible-doc --type callback cgroup_memory_Conclusion
ansible-doc --type callback cgroup_perf_Conclusion
Both plugins require cgroups, so make sure to install the libcgroup-tools package in RHEL7 and RHEL8, which provides a userspace interface for managing cgroups:
dnf install -y libcgroup-tools
Please note that libcgroup was dropped from RHEL9 since most of its functionality is handled by systemd.
Links
- https://docs.ansible.com/ansible/latest/collections/community/general/cgroup_memory_Conclusion_callback.html
- https://docs.ansible.com/ansible/latest/collections/ansible/posix/cgroup_perf_Conclusion_callback.html

Configuring Callback Plugins
To use these callback plugins during playbook execution, you need to adjust the ansible.cfg configuration file. Here’s an example of how our ansible.cfg file might look after these adjustments:
[defaults]
callback_whitelist=timer, profile_tasks, profile_roles, cgroup_perf_Conclusion, cgroup_memory_recap

[callback_cgroup_perf_Conclusion]
control_group=ansible

[callback_cgroupmemConclusion]
cur_mem_file = /sys/fs/cgroup/memory/ansible_profile/memory.usage_in_bytes
max_mem_file = /sys/fs/cgroup/memory/ansible_profile/memory.max_usage_in_bytes
You’re almost ready to collect resource consumption data during playbook execution.
Running Playbooks with Callback Plugins
Before executing playbooks with callback plugins, you need to create a cgroup for Ansible to run from and specify the controllers for the control group for the ansible user using cgcreate as root:
cgcreate -a ansible:ansible -t ansible:ansible -g cpuacct,memory,pids:ansible_profile
Now, let’s activate the callback plugins during playbook execution. Assuming you have thedeploy-httpd.yml playbook, you can use the following commands:
For deploying the web server:
cgexec -g cpuacct,memory,pids:ansible_profile ansible-playbook deploy-httpd.yml
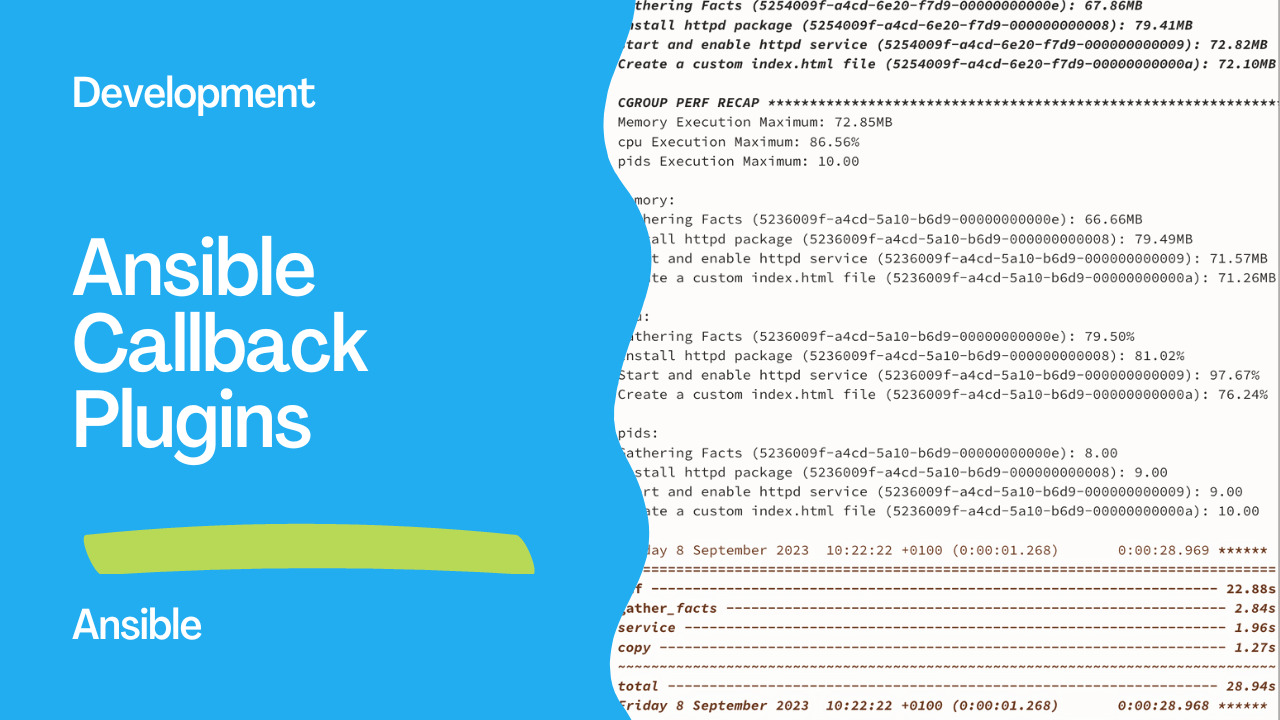
Analyzing the Callback Plugin Output
After running your playbooks with callback plugins, you’ll get detailed information about resource consumption, task execution times, and more. Here’s an example of the output:
PLAY RECAP ******************************************************************************************************************************************
demo.example.com                    : ok=4    changed=2    unreachable=0    failed=0    skipped=0    rescued=0    ignored=0


CGROUP MEMORY RECAP *********************************************************************************************************************************
Execution Maximum: 83.96MB

Gathering Facts (5254009f-a4cd-6e20-f7d9-00000000000e): 67.86MB
Install httpd package (5254009f-a4cd-6e20-f7d9-000000000008): 79.41MB
Start and enable httpd service (5254009f-a4cd-6e20-f7d9-000000000009): 72.82MB
Create a custom index.html file (5254009f-a4cd-6e20-f7d9-00000000000a): 72.10MB

CGROUP PERF RECAP ***********************************************************************************************************************************
Memory Execution Maximum: 72.85MB
cpu Execution Maximum: 86.56%
pids Execution Maximum: 10.00

memory:
Gathering Facts (5236009f-a4cd-5a10-b6d9-00000000000e): 66.66MB
Install httpd package (5236009f-a4cd-5a10-b6d9-000000000008): 79.49MB
Start and enable httpd service (5236009f-a4cd-5a10-b6d9-000000000009): 71.57MB
Create a custom index.html file (5236009f-a4cd-5a10-b6d9-00000000000a): 71.26MB

cpu:
Gathering Facts (5236009f-a4cd-5a10-b6d9-00000000000e): 79.50%
Install httpd package (5236009f-a4cd-5a10-b6d9-000000000008): 81.02%
Start and enable httpd service (5236009f-a4cd-5a10-b6d9-000000000009): 97.67%
Create a custom index.html file (5236009f-a4cd-5a10-b6d9-00000000000a): 76.24%

pids:
Gathering Facts (5236009f-a4cd-5a10-b6d9-00000000000e): 8.00
Install httpd package (5236009f-a4cd-5a10-b6d9-000000000008): 9.00
Start and enable httpd service (5236009f-a4cd-5a10-b6d9-000000000009): 9.00
Create a custom index.html file (5236009f-a4cd-5a10-b6d9-00000000000a): 10.00

Friday 8 September 2023  10:22:22 +0100 (0:00:01.268)       0:00:28.969 ******
===============================================================================
dnf -------------------------------------------------------------------- 22.88s
gather_facts ------------------------------------------------------------ 2.84s
service ----------------------------------------------------------------- 1.96s
copy -------------------------------------------------------------------- 1.27s
~~~~~~~~~~~~~~~~~~~~~~~~~~~~~~~~~~~~~~~~~~~~~~~~~~~~~~~~~~~~~~~~~~~~~~~~~~~~~~~
total ------------------------------------------------------------------ 28.94s
Friday 8 September 2023  10:22:22 +0100 (0:00:01.268)       0:00:28.968 ******
===============================================================================
Install httpd package ----------------------------------------------------------------------------------------------------------------------- 22.88s
Gathering Facts ------------------------------------------------------------------------------------------------------------------------------ 2.84s
Start and enable httpd service --------------------------------------------------------------------------------------------------------------- 1.96s
Create a custom index.html file -------------------------------------------------------------------------------------------------------------- 1.27s
Playbook run took 0 days, 0 hours, 0 minutes, 28 seconds
The output provides valuable insights into how much memory and CPU each task consumed, making it easier to identify performance bottlenecks or resource-intensive tasks.
Conclusion
By using Ansible callback plugins, you can gain deeper insights into resource consumption during playbook execution. These plugins provide valuable information for troubleshooting and optimizing your Ansible automation tasks. You can also explore other callback plugins to enhance your Ansible Automation Platform experience.
This article has Playbooknstrated how callback plugins work, focusing on two specific plugins that profile system activity and memory usage. With this knowledge, you can enhance your Ansible automation and make more informed decisions when managing your infrastructure.
Subscribe to the YouTube channel, Medium, and Website, X (formerly Twitter) to not miss the next episode of the Ansible Pilot.Academy
Learn the Ansible automation technology with some real-life examples in my
Udemy 300+ Lessons Video Course.

My book Ansible By Examples: 200+ Automation Examples For Linux and Windows System Administrator and DevOps

Donate
Want to keep this project going? Please donate